Influence oxidation resistance of graphite--graphitization catalysts discussion
Influence oxidation resistance of graphite--graphitization catalysts discussion
1 The effect of Pr6O11 on the oxidation resistance of graphite
Pr6O11 is produced by Shanghai Aladdin Biochemical Technology Co., Ltd., with a purity of 99.9%. Modified asphalt and needle coke are uniformly mixed, and then 0%, 0.5%, 1.0%, 3.0% and 5.0% of Pr6O11 are added, and the additive proportion is based on the mass fraction of needle coke. Get related graphite electrodes products. The prepared samples are marked with symbols G-P0, G-P0.5, G-P1.0, G-P3.0, and G-P5.0 respectively. The sample G-P0 represents the sample without Pr6O11.
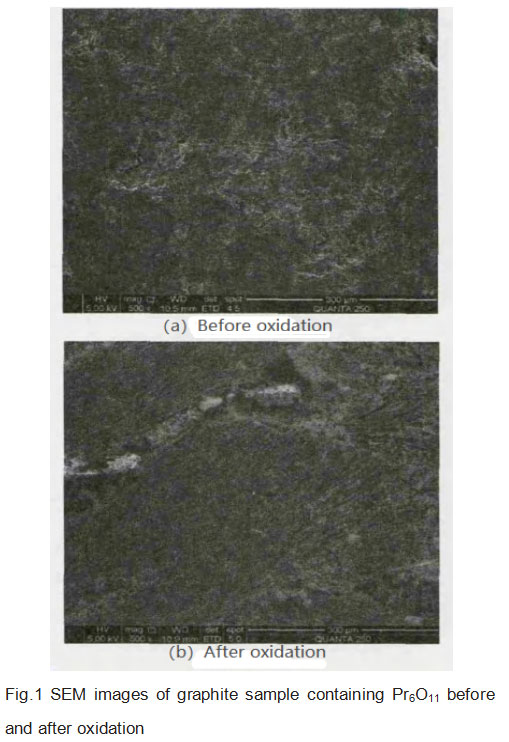
Figure 1 is the SEM picture before and after the oxidation of the graphite sample with Pr6O11. It can be seen that after the graphite sample is oxidized, there are obvious cracks between the particles, and they are filled with scattered porous sponge-like objects; while a few dents appear on the surface of the particles and become rough and exist. A small amount of sponge-like objects indicates that oxidation mainly occurs in the grain boundary area.
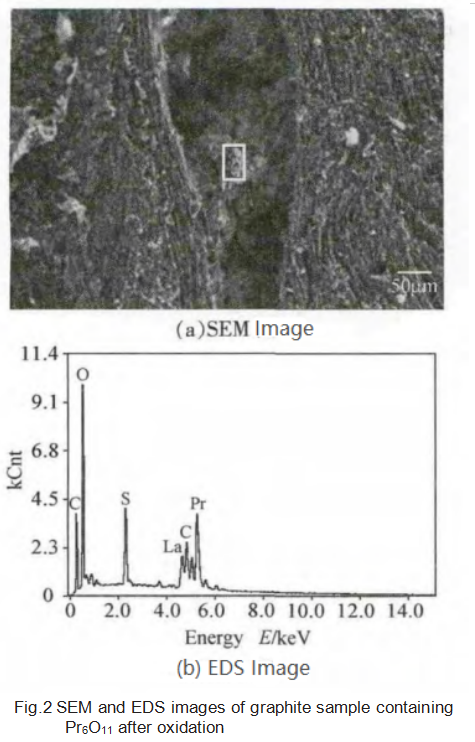
From the EDS test results in Figure 2, it can be seen that the severely oxidized area between the particles contains a large amount of Pr, and the content of C decreases after oxidation, which further increases the relative content of Pr. The sponge-like substance in the figure is a mixture of Pr, O and a small amount of C; There is a small amount of Pr inside the particle to promote the oxidation of C, and the degree of oxidation of the area without Pr is very light.
In the process of preparing graphite samples, modified pitch and needle coke are used as carbon sources. Therefore, the sample XRD data is a combination of the two components, as shown in Figure 3.
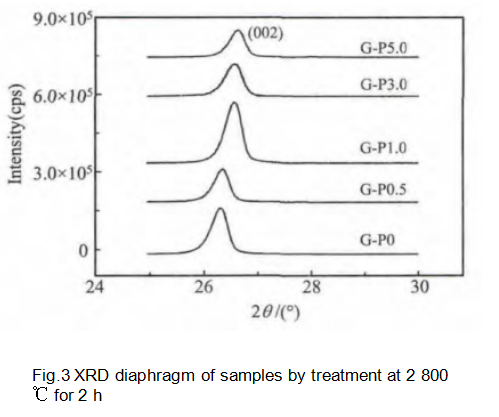
Table 1 lists the lattice parameters of the graphite samples, and all the samples are prepared by the same process. The value of 2θ is determined by the centroid of the diffraction peak; the position of the d002 peak is corrected by the silicon standard; the interlayer spacing d002 is calculated by the Bragg equation, as in equation (3); the average stacking height (Lc) of the crystallites in the c-axis direction is determined by the Scherrer equation calculate as equation (2), where λ is 0.154056 nm; the graphitization degree g is calculated by equation (4).
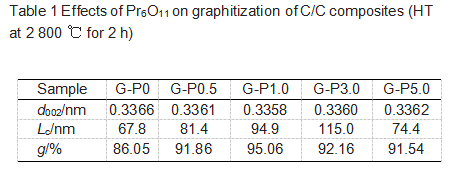
Compared with G-P0, graphite samples with Pr6O11 added have reduced interlayer spacing and increased grain size. The interlayer spacing of G-P0 is 0.3366 nm, and the interlayer spacing of G-P1.0 is reduced to 0.3358 nm. If the concentration of Pr6O11 is further increased, the interlayer spacing increases instead, as shown in the samples G-P3.0 and G-P5.0 in Table 1. However, the largest crystal size (Lc) appeared in sample G-P3.0. Therefore, a catalyst concentration higher than 3% can locally graphitize the matrix, reduce the crystal size and increase the boundary concentration of the crystal. The results show that when the additive amount of Pr6O11 is 1%, it has the best catalytic graphitization effect, but the additive amount of 3% can best promote the growth of the crystal size Lc.
For carbon materials, the Raman spectrum can effectively reflect the defects and disorder. The Raman spectrum of the measured graphite sample is shown in Figure 4.
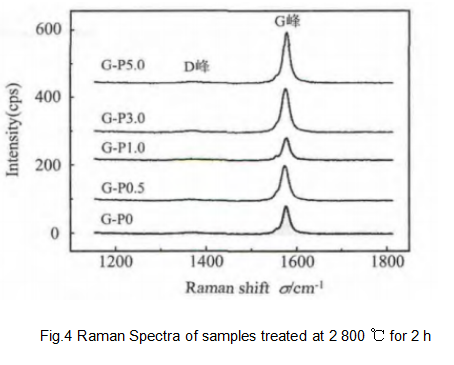
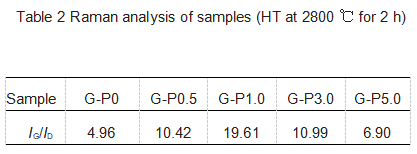
It can be seen from Table 2 that the sample G-P0 Raman spectrum peak intensity ratio IG/ID is 4.96, and by adding the additive Pr6O11, the sample G-P1.0 Raman spectrum peak intensity ratio IG/ID increases to 19.61. Based on the above conclusions, the degree of graphitization can be improved by adding Pr6O11. However, if the Pr6O11 content is further increased, the intensity ratio IG/ID decreases, as shown in Table 2 for samples G-P3.0 and G-P5.0. These results show that the results of Raman spectroscopy and XRD are consistent, that is to say, there is the best additive content, about 1%, which has the best catalytic graphitization effect.
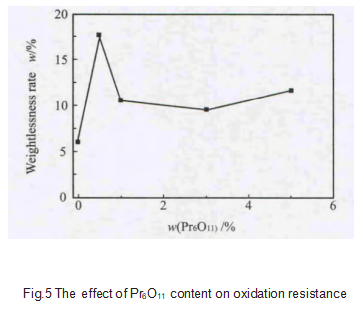
After oxidation treatment, the weight loss rate of the sample is shown in Figure 5. The Pr6O11 additive generally promotes the oxidation of graphite samples. This is because the binding energy and separation energy of Pr-C are relatively low, making C easier to react, that is, reducing the activation energy of C. With the increase of Pr6O11 content, the weight loss rate first increases sharply, then gradually decreases, and finally rises slowly. The change trend is opposite to the change of graphitization degree. When the content is 0.5%, the sample weight loss rate is the largest, which is 17.56%; when the content is 3%, the sample weight loss rate is the smallest, which is 9.58%. This is because when the Pr content is small, the sample cannot be fully catalyzed and graphitized, resulting in the sample containing more amorphous carbon. These carbon atoms have higher energy and lower oxidation resistance; while the Pr content is higher, that is, >3%, resulting in more crystal grains in the sample, the grain boundary content is higher, the carbon atom energy on the grain boundary is higher, and the oxidation resistance is poor, view more graphite products information.
No related results found


0 Replies