Calcined petroleum coke export statistics

Calcined petroleum coke export statistics
Table 2 Calcined petroleum coke export statistics
Date | Export volume (10000 tons) | Year-on-year | Month-on-month |
November 2021 | 6.32 | / | -43.97% |
October 2022 | 8.04 | -28.76% | -36.42% |
November 2022 | 11.38 | 80.07% | 41.61% |
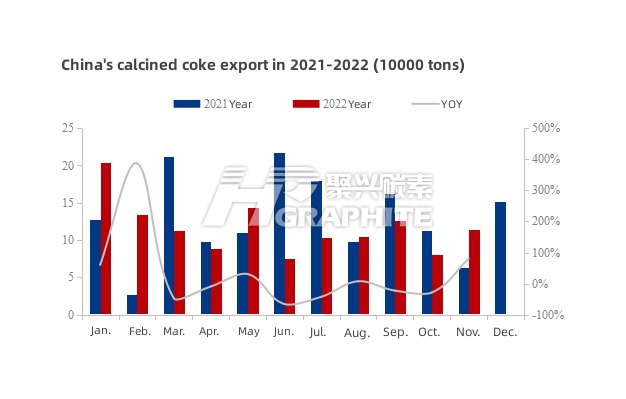
Jan. - Nov. 2022 | 128.66 | -8.63% | / |
Source: China Customs
In November 2022, China's calcined petroleum coke export volume was 113,800 tons, up 41.61% month-on-month and 80.07% year-on-year, with a total export value of $100,930,200, of which the country with the largest S < 0.8% calcined petroleum coke export volume is the Russian Federation, with 2,041.12 tons export volume, $3,217,700 total export amount, and $1576.41/ton average export price. India was the largest exporter of other calcined coke, with 25,710 tons export volume, $23,010,500 total export value, and $895/ton average export price. In 2022, the total export volume were 1,286,600 tons.
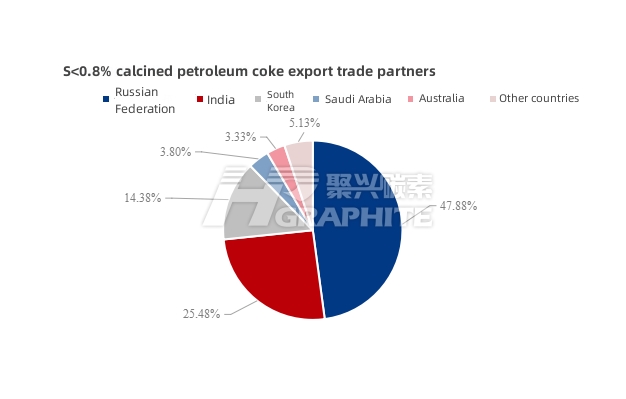
In November 2022, China S < 0.8% calcined petroleum coke export volume was 4263.307 tons. The top 5 were the Russian Federation accounting for 47.88%, India accounting for 25.48%, South Korea accounting for 14.38%, Saudi Arabia accounting for 3.8%, and Australia accounting for 5.13%.
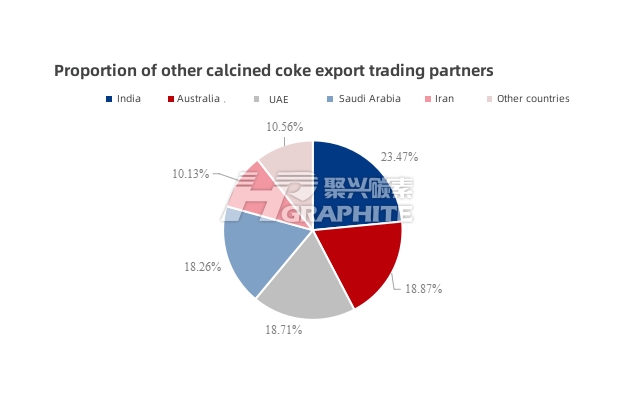
In November 2022, China other calcined petroleum coke export volume was 109,500 tons, with India accounting for 23.47%, Australia accounting for 18.87%, the United Arab Emirates accounting for 18.71%, Saudi Arabia accounting for 18.26% and Iran accounting for 10.13%.
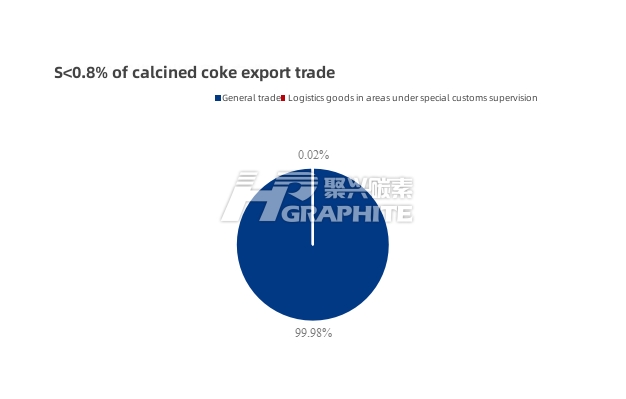
According to the trade model, the general trade proportion of S<0.8% calcined petroleum coke was 99.98%, and the proportion of logistics goods in the special customs supervision area was 0.02%.
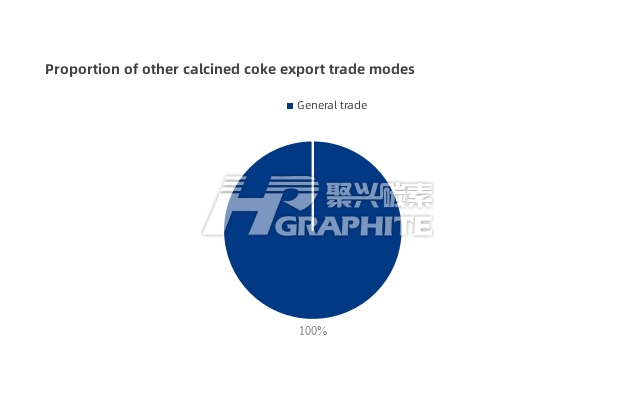
According to the trade mode, the proportion of general trade in other calcined petroleum coke was 100%. China calcined petroleum coke import and export trade more reports, feel free to contact us.
No related results found


0 Replies